
A D2C brand processes 600 orders a month and believes their logistics are working fine. Customer complaints are manageable. The team is busy but coping. No one has sat down to calculate the numbers.
When they finally do: RTO rate is 24%. First-attempt delivery success rate is 68%. Average cost per delivered order including RTO provision is ₹118, not the ₹72 they thought they were paying. One courier has a 31% RTO rate on Zone D COD orders. Another has a 1.4% loss rate.
None of this was visible without a delivery performance report. In India's rapidly scaling logistics ecosystem, the businesses that make data-driven decisions about courier selection, packaging, and COD management outperform those that manage by instinct alone. The delivery performance report is the instrument that makes those decisions possible. Courier aggregators are increasingly recognised as the backbone of this shift, giving D2C brands the technology-driven, data-first logistics infrastructure that used to be available only to much larger sellers (IBEF).
This guide covers which metrics to track, how to calculate each one, how to structure a monthly report, and what decisions to make from the data.
What Is a Delivery Performance Report?
A delivery performance report is a monthly, structured analysis of a business's logistics operation, built from metrics like delivery success rate, RTO rate, first-attempt success rate, and effective cost per delivered order. Instead of relying on a single headline number - like the per-shipment freight rate a courier quotes - it surfaces the real cost and performance picture, including RTO freight, discrepancy charges, and losses that a simple invoice never shows. Most businesses that build one discover their actual cost per delivered order is well above what they assumed, because the assumed number never accounted for what came back.
How to Gather the Data You Need Before Building the Report
- Total shipments booked in the period, by courier
- Delivered shipments, by courier
- RTO shipments, by courier and by payment type (COD vs prepaid)
- NDR counts and NDR-to-RTO conversion rate
- Total courier invoiced amount and disputed amount
- Weight discrepancy charges raised and recovered
- Shipment loss count and claim recovery amount
- Average transit time by zone and by courier
The 10 Metrics Every Delivery Performance Report Must Include
Metric 1: Delivery Success Rate
Formula: (Delivered shipments / Total shipments dispatched) x 100
What it tells you: The percentage of dispatched orders that successfully reached the customer. This is the headline metric of delivery performance.
Benchmark: Above 85% is the minimum acceptable. Above 92% is strong for mixed COD/prepaid operations. Below 80% requires immediate investigation.
Break it down by: Courier, zone, payment type (COD vs prepaid), and product category. A blended 85% can hide a catastrophic 60% on one courier's Zone D COD shipments.
Metric 2: RTO Rate
Formula: (RTO shipments / Total shipments dispatched) x 100
What it tells you: The percentage of shipments that came back. Every RTO costs forward freight plus return freight with zero revenue. This is the most directly margin-destructive metric in the report.
Benchmark: Below 10% overall. Below 8% for prepaid. Below 20% for COD. Above 25% COD RTO requires active intervention.
Break it down by: Courier, payment type, zone, and RTO reason (refused, address not found, customer unavailable, fake NDR). Reason analysis is where the fix lies.
Metric 3: First-Attempt Delivery Success Rate
Formula: (Shipments delivered on first attempt / Total shipments dispatched) x 100
What it tells you: How often the courier delivers on the first try - without NDR, reattempt, or delay. First-attempt success is the true measure of delivery efficiency. Every failed first attempt costs the courier (and often the business) additional time and operational cost.
Benchmark: Above 75% is good. Above 85% is excellent. Below 65% indicates systematic delivery issues - address quality, courier performance, or customer communication gaps.
Metric 4: NDR-to-RTO Conversion Rate
Formula: (NDRs that converted to RTO / Total NDRs) x 100
What it tells you: Of every delivery that failed on the first attempt, what percentage ultimately came back as RTO rather than being successfully reattempted. A high NDR-to-RTO rate means the reattempt system is not working - either the seller is not acting on NDRs fast enough, or the courier's reattempt process is ineffective.
Benchmark: Below 30% is good. Above 50% means NDR management needs immediate improvement.
Metric 5: Average Transit Time by Zone
Formula: Average of (delivery date - dispatch date) for all delivered shipments, grouped by zone
What it tells you: How long deliveries are actually taking versus what the courier's SLA promises. Compare actual transit time against SLA commitment for each courier on each zone. Couriers that consistently breach their own transit SLA should receive volume only on zones where they perform.
Track separately for: Each courier x each zone combination. A courier that performs well on Zone A but consistently breaches Zone D SLA should not be used for Zone D regardless of their rate.
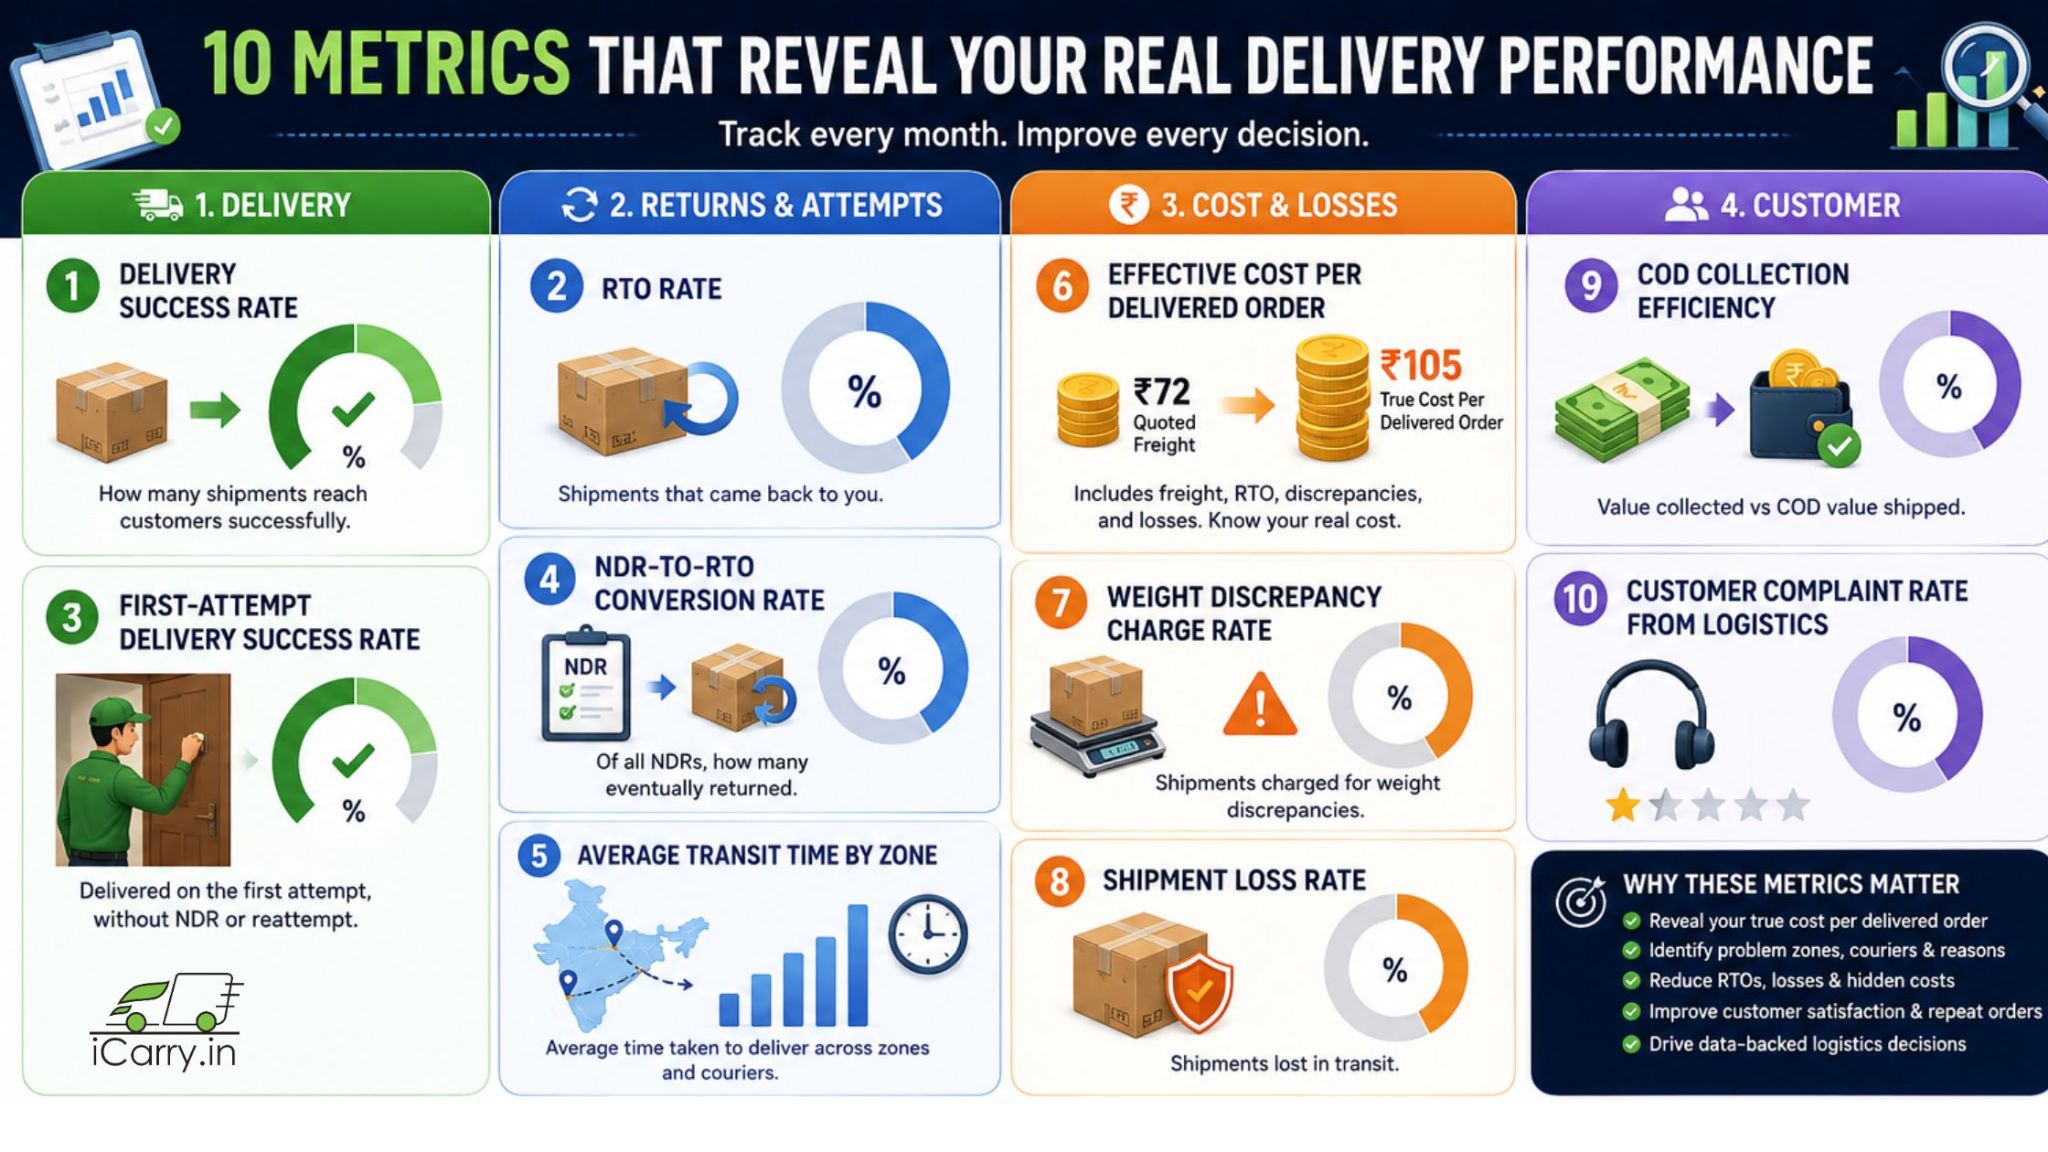
Metric 6: Effective Cost Per Delivered Order
Formula: (Total courier spend + RTO freight cost) / Successfully delivered shipments
What it tells you: The true cost per order that reaches a customer. Most businesses calculate shipping cost per shipment dispatched - which ignores the cost of orders that came back. Effective cost per delivered order includes the full RTO freight cost divided across the delivered base.
Example: 100 orders dispatched at ₹72 each = ₹7,200. 20 RTOs at ₹60 return freight = ₹1,200. Total cost: ₹8,400. Delivered orders: 80. Effective cost per delivered order: ₹105 - not ₹72.
Metric 7: Weight Discrepancy Charge Rate
Formula: (Total weight discrepancy charges raised / Total shipments) and (Charges disputed / Charges raised)
What it tells you: How frequently couriers raise weight discrepancies against your declared weights, and how much of those charges you are recovering through disputes. A high discrepancy rate with a low recovery rate means either your declarations are genuinely inaccurate or your dispute evidence is weak.
Track by courier: Some couriers raise significantly more discrepancy charges than others. High discrepancy frequency from a specific courier is worth investigating before attributing it to your packing team.
Metric 8: Shipment Loss Rate
Formula: (Confirmed lost shipments / Total shipments) x 100
What it tells you: The percentage of shipments that are confirmed as lost - not returned, not delayed, but unrecoverable. Even a 0.5% loss rate on 1,000 monthly shipments is 5 lost parcels per month. At ₹2,500 average declared value, that is ₹12,500 per month in exposure if coverage is not enabled.
Track alongside: Claim recovery rate - what percentage of loss value is being recovered through the claims process. Low recovery rate is often a documentation problem, not a courier refusal problem.
Metric 9: COD Collection Efficiency
Formula: (COD amount remitted / COD orders delivered) compared to expected average COD order value
What it tells you: Whether the courier is collecting the correct COD amount on every order. A mismatch between expected COD collections and actual remittances indicates either incorrect declared COD amounts at booking or COD collection failures by delivery agents.
Metric 10: Customer Complaint Rate from Logistics
Formula: (Customer complaints attributable to logistics - late delivery, wrong item, damage, non-delivery - / Total delivered orders) x 100
What it tells you: How much of your customer support volume and negative review risk is being generated by logistics. A rising logistics complaint rate is a leading indicator of delivery performance decline before it appears clearly in other metrics.
Building the Monthly Delivery Performance Report
Structure your monthly report in five sections:
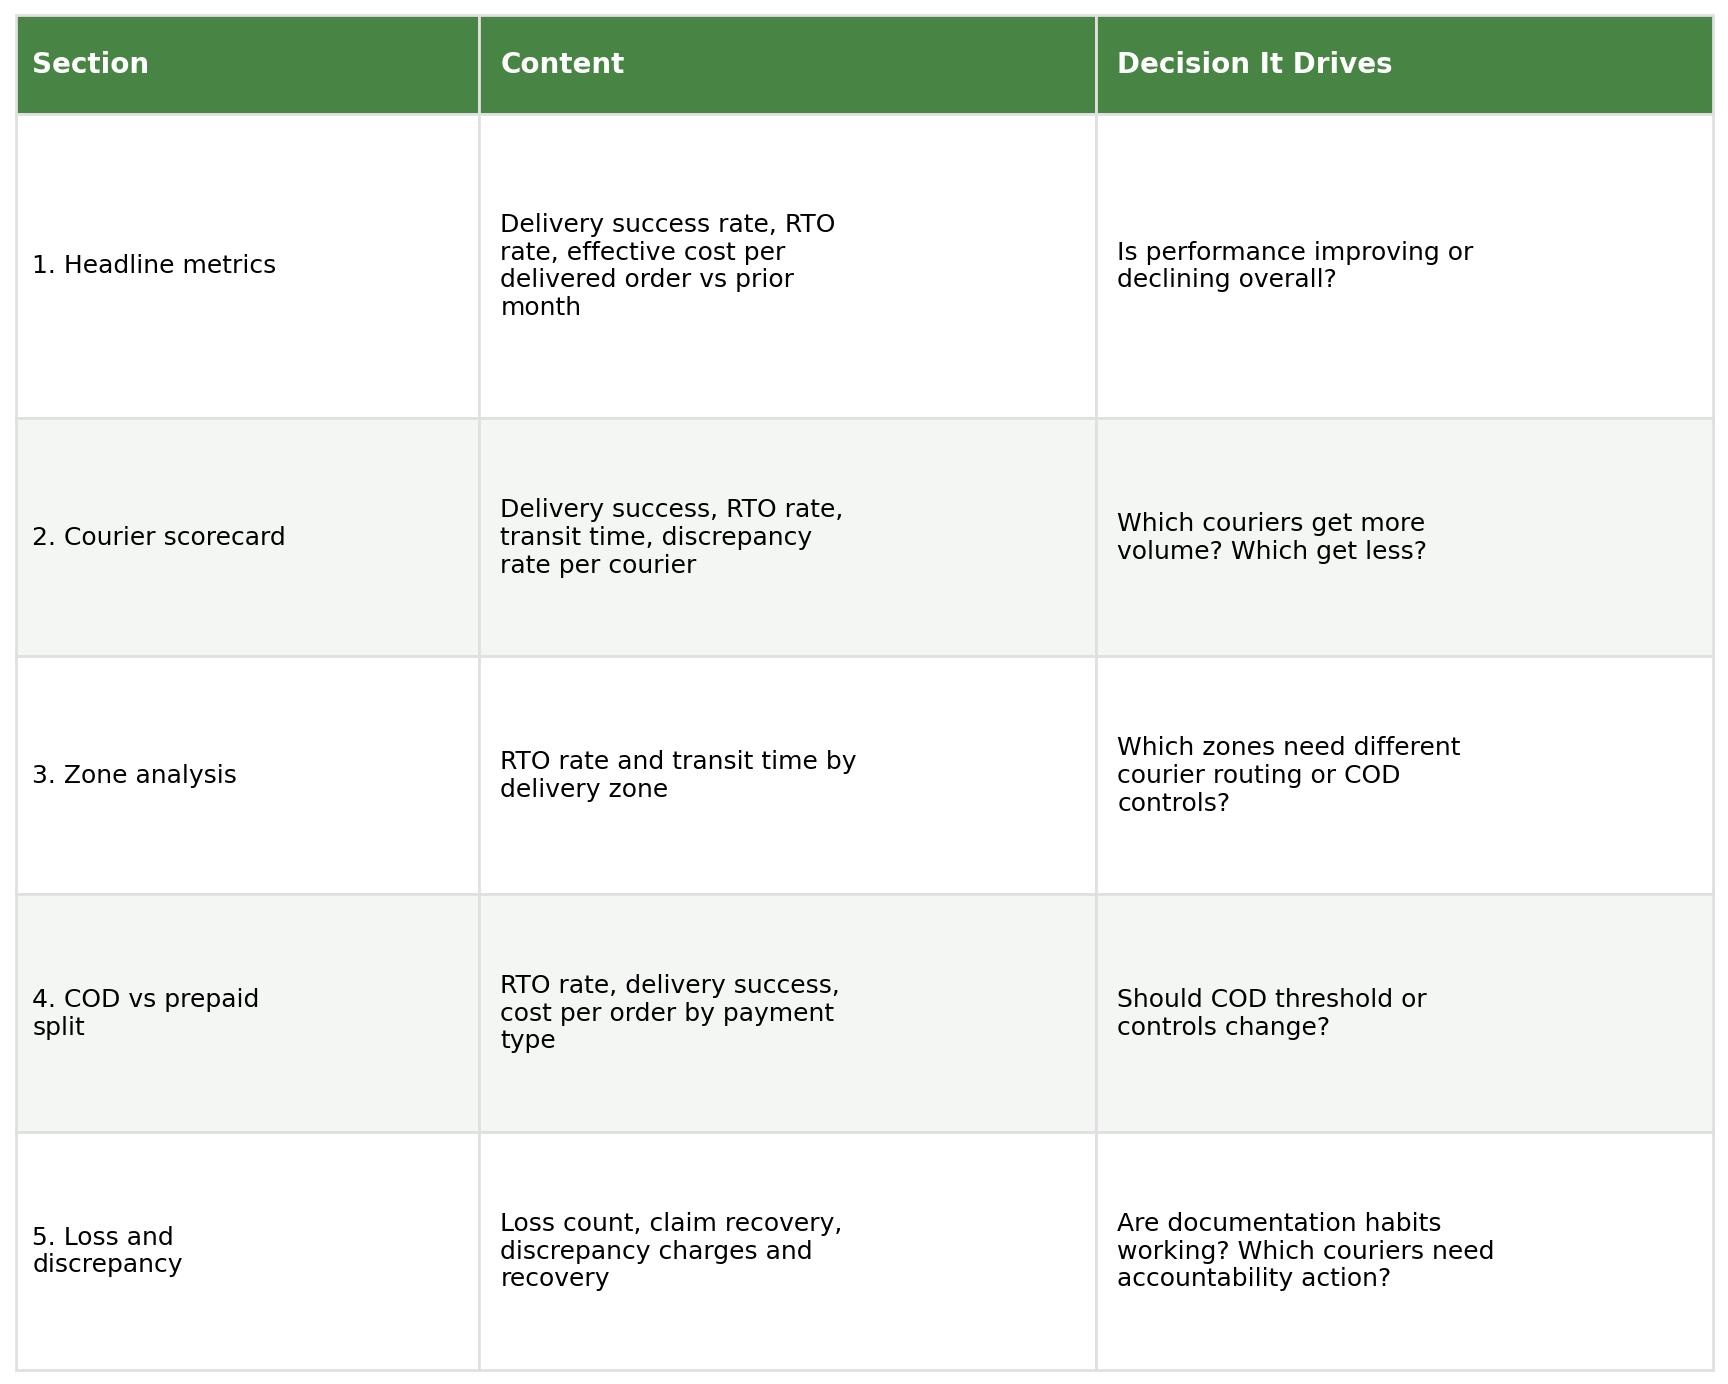
The report should be reviewed monthly by whoever makes courier allocation, pricing, and dispatch SOP decisions. It should take not more than 2 hours to compile from courier aggregator data exports. The decisions it drives should be implemented before the next month's report.
What to Do With the Data - Decision Framework
- Courier with RTO above 25% on COD Zone D: Reduce volume on that route. Switch COD Zone D orders for that courier to a better-performing alternative
- NDR-to-RTO above 50%: NDR management process is broken. Implement mandatory 24-hour NDR response. Consider iCarry® Delivery Boost for high-risk COD orders.
- Effective cost per delivered order rising month-on-month: Either RTO rate is rising, freight rates are increasing, or both. Investigate RTO reasons first - it has the highest leverage on effective cost
- Discrepancy charges high with low recovery: Packing team is not weighing after sealing, or claim evidence (photographs) is not being gathered. Fix both before next month
- Loss rate above 0.5% on a specific courier: Raise formally with the courier. Route high-value shipments away from that courier on the problematic routes immediately
How iCarry® Provides the Data for Your Report
iCarry® is a courier aggregator that gives Indian businesses visibility into delivery performance across all courier partners from one dashboard:
- My Shipments: Filter by date range, courier, status (delivered, RTO, NDR, in transit). Export shipment data for any period to build your performance report
- Weight discrepancy dashboard: All discrepancy charges raised, disputed, and resolved in one view. Dispute rate and recovery rate calculable from this data
- COD remittance records: Track COD amounts collected, expected remittances, and settlement status across courier partners for accurate COD collection efficiency analysis. Monitor standard T+7 settlements, access Early COD options from T+0 for faster cash flow, and maintain visibility into COD performance without manual reconciliation.
- Support ticket log: All trace requests and loss claims filed, with status. Loss rate and claim recovery calculable from this data
- Multi-courier data in one account: Performance comparison across Delhivery, Blue Dart, Xpressbees, Ekart, Amazon Shipping, and other active partners from a single data source - no aggregating from multiple portals
Free Bronze plan, no minimum volume.
Final Thoughts
A delivery performance report is not a reporting exercise - it is a decision-making tool. The metrics in this guide exist because each one drives a specific operational or commercial decision: which courier gets more volume, where COD controls need tightening, which packing habits need fixing, and where claims need to be filed.
Businesses that review these metrics monthly make better courier decisions, build better dispatch SOPs, and negotiate from a position of data rather than assumption. Over 12 months, the compound effect of monthly data-driven improvements in RTO rate, effective delivery cost, and discrepancy recovery is a meaningful margin advantage.
Build the report once. Review it monthly. Act on what it tells you. The data is already there in your courier aggregator account.
Frequently Asked Questions (FAQs)
What is a delivery performance report?
A monthly structured analysis of your logistics operation covering key metrics: delivery success rate, RTO rate, first-attempt success rate, NDR-to-RTO conversion, average transit time by zone, effective cost per delivered order, weight discrepancy charge rate, and shipment loss rate. Used to make data-driven decisions about courier allocation, COD policy, and dispatch SOPs.
What is the most important logistics metric for Indian sellers to track?
RTO rate and effective cost per delivered order are the highest-priority metrics for most Indian businesses. RTO rate is the most directly margin-destructive metric - every returned order costs double freight with zero revenue. Effective cost per delivered order is the true logistics cost metric - it includes RTO freight in the calculation and is always higher than the simple per-shipment rate.
How do I calculate effective cost per delivered order?
Add total courier freight spend and total RTO return freight for the period. Divide by the number of successfully delivered shipments (not total dispatched). This gives the true cost to deliver one order that reaches a customer. Most businesses discover their effective cost is 15 to 35% higher than their headline per-shipment rate once RTO freight is included.
How often should I review my delivery performance report?
Monthly at minimum. Weekly for businesses above 500 daily shipments where small performance shifts have significant financial impact. The report should drive specific actions before the next review period - courier routing changes, NDR management improvements, or discrepancy dispute processes - not just be read and filed.
How does iCarry® help me build a delivery performance report?
iCarry® 's My Shipments dashboard provides filterable data across all courier partners - by date, courier, status, and others. Export shipment data for any period to calculate delivery success, RTO rate, and transit time by courier. The weight discrepancy dashboard provides discrepancy charge and recovery data. COD remittance records support collection efficiency analysis. All from one account, across all couriers.
A delivery performance report turns a vague sense of "logistics are fine" into ten specific numbers you can act on. RTO rate and effective cost per delivered order matter most, but the real value is in breaking every metric down by courier, zone, and payment type - because a healthy blended average routinely hides a courier or route that is quietly destroying margin. Build the report once, review it monthly, and let the data - not instinct - decide where volume goes next.