What is Ecommerce Analytics?
eCommerce analytics is the process of collecting and analyzing data from online stores to track performance, understand customer behavior, and improve sales, marketing, and operations.
It helps businesses:
- Measure conversion rates
- Track customer acquisition cost (CAC)
- Improve customer lifetime value (CLV)
- Optimize marketing ROI
- Reduce cart abandonment
Running a successful eCommerce business today requires more than just launching a website and listing products online. With intense competition across digital marketplaces, businesses must continuously analyze customer behavior, marketing performance, and operational efficiency to make better decisions.
Industry research from McKinsey's analytics insights shows that data-driven organizations consistently outperform competitors in productivity and profitability.
This is where eCommerce analytics becomes essential.
eCommerce analytics involves collecting and analyzing data from online stores, marketing campaigns, and customer interactions to understand what drives sales and business growth. Data analytics has become a core capability for modern digital commerce and online business decision-making according to OECD research on data-driven innovation. By tracking the right metrics, businesses can identify which products perform best, which marketing channels generate revenue, and where operational improvements are needed.
Modern analytics platforms such as Google Analytics, Shopify Analytics, and Adobe Analytics allow businesses to monitor store performance in real time.
These tools help companies track customer behavior, traffic sources, and marketing performance across digital channels.
Web analytics tools help organizations measure user behavior, traffic sources, and engagement patterns across digital platforms as documented in W3C web accessibility guidelines.
For eCommerce founders, digital marketers, and operations teams, understanding analytics is critical for improving conversion rates, customer acquisition strategies, inventory planning, and logistics efficiency, especially when scaling data-driven marketing strategies.
This guide explains eCommerce analytics, key metrics every online business should track, commonly used analytics tools, and strategies for using data to scale online stores.
Clear Definition
eCommerce analytics is the process of collecting, measuring, and analyzing data from online stores to understand customer behavior, track performance metrics, and improve marketing, sales, and operational decisions.
It helps businesses answer questions such as:
- Which products generate the most sales?
- Which marketing channels drive traffic?
- Where do customers drop off during checkout?
- How profitable are marketing campaigns?
In simple terms:
eCommerce analytics helps businesses understand what is working in their online store and what needs improvement.
Why eCommerce Analytics Matters for Online Businesses
eCommerce analytics plays a crucial role in helping online businesses understand customer behavior, optimize marketing strategies, and improve overall store performance. Instead of relying on assumptions, analytics enables companies to make data-driven decisions that directly impact revenue growth and customer experience.
1. Better Customer Insights
One of the biggest advantages of eCommerce analytics is the ability to understand customer behavior in detail. By analyzing browsing patterns, purchase history, and engagement data, businesses can identify customer preferences and buying habits. These insights help brands personalize their marketing campaigns, improve product discovery, and implement intelligent product recommendation strategies that increase conversions.
2. Improved Marketing ROI
Analytics helps businesses determine which marketing channels generate the highest revenue. By tracking performance across channels such as organic search, paid advertising, social media, and email campaigns, companies can allocate budgets more effectively and maximize return on investment (ROI).
3. Higher Conversion Rates
By analyzing user behavior, businesses can identify friction points in the shopping journey. Insights from analytics allow brands to optimize product pages, simplify checkout processes, and improve site usability—leading to higher conversion rates and increased sales.
4. Smarter Inventory Management
Data-driven insights enable businesses to predict product demand more accurately and identify high-demand product categories for online selling. Analytics can highlight which products are selling quickly and which items are slow-moving, helping companies reduce stockouts, avoid overstocking, and improve inventory planning.
5. Data-Driven Decision Making
Perhaps the most important benefit of analytics is that it replaces guesswork with measurable insights. Businesses can make informed strategic decisions based on real data, improving operational efficiency and long-term growth.
Core eCommerce Analytics Metrics Every Online Store Should Track
Tracking the right performance metrics is essential for measuring the success of an online store. These metrics help businesses evaluate marketing performance, customer behavior, and revenue growth.
Conversion Rate
The conversion rate measures the percentage of website visitors who complete a purchase. It is one of the most important indicators of how effectively a store turns visitors into customers.
Formula:
Conversion Rate = (Number of Purchases / Website Visitors) × 100
Average eCommerce Conversion Rate Benchmarks
A higher conversion rate usually indicates optimized product pages, clear value propositions, and a smooth checkout process.
Customer Acquisition Cost (CAC)
Customer Acquisition Cost represents the total cost required to acquire a new customer through marketing and advertising efforts.
Formula:
CAC = Total Marketing Spend / Number of New Customers
For sustainable growth, businesses must ensure that CAC remains significantly lower than the revenue generated from each customer.
Average Order Value (AOV)
Average Order Value measures the average amount customers spend per transaction.
Formula:
AOV = Total Revenue / Number of Orders
Increasing AOV allows businesses to generate more revenue without increasing marketing spend. Strategies such as product bundling, upselling, and cross-selling are commonly used to improve this metric.
Customer Lifetime Value (CLV)
Customer Lifetime Value represents the total revenue a business can expect from a customer throughout their relationship with the brand.
Formula:
CLV = Average Order Value × Purchase Frequency × Customer Lifespan
A higher CLV indicates strong customer retention and brand loyalty, making it easier to scale profitably.
Cart Abandonment Rate
Cart abandonment rate measures the percentage of users who add products to their cart but leave the website without completing the purchase.
Research on online shopping behavior shows that checkout complexity, unexpected costs, and payment friction are among the most common reasons for cart abandonment.
Industry Benchmark
Reducing cart abandonment through optimized checkout flows, reminder emails, and simplified payment options can significantly increase revenue.
According to research by the Baymard Institute, the average cart abandonment rate across eCommerce websites is approximately 70%.
Return on Ad Spend (ROAS)
Return on Ad Spend measures the revenue generated from advertising campaigns relative to the amount spent.
Formula:
ROAS = Revenue from Ads / Advertising Spend
This metric helps businesses evaluate the effectiveness of their advertising campaigns and optimize marketing budgets.
Step-by-Step eCommerce Analytics Process
Implementing eCommerce analytics requires a structured approach. Businesses that follow a systematic analytics process can generate meaningful insights and continuously improve their operations.
Step 1: Data Collection
The first step is collecting accurate data from multiple sources. Businesses track website traffic, customer behavior, and purchase transactions using analytics tools.
Step 2: Data Organization
Once collected, data must be structured into meaningful categories such as traffic sources, conversion rates, revenue metrics, and customer segments.
Step 3: Performance Analysis
Businesses analyze patterns and trends within the data to identify opportunities for growth and potential operational issues affecting performance.
Step 4: Implement Improvements
Insights generated from analytics should lead to actionable improvements. These often include optimizing product pages, adjusting pricing strategies, improving marketing campaigns, and enhancing user experience.
Step 5: Monitor and Optimize
Analytics is an ongoing process. Continuous monitoring helps businesses measure the impact of changes and refine strategies over time.
Popular eCommerce Analytics Tools
Several analytics platforms help businesses measure and optimize online store performance. These tools provide insights into traffic sources, customer behavior, and conversion performance.
Using a combination of these tools enables businesses to gain both high-level performance insights and detailed user behavior analysis.
Understanding eCommerce Traffic Sources
Analyzing traffic sources helps businesses identify where their visitors are coming from and which channels drive the most valuable customers.
Diversifying traffic sources reduces dependency on a single channel and strengthens marketing stability.
Digital marketing research from Google's Think with Google insights consistently recommends diversified traffic acquisition strategies to reduce risk and improve long-term growth.
Key Benefits of eCommerce Analytics
Implementing analytics effectively can significantly improve business performance.
Better Marketing Optimization - Analytics helps businesses allocate marketing budgets toward the most profitable channels and campaigns.
Improved Customer Experience - Data insights reveal user behavior patterns, allowing businesses to optimize website navigation, checkout flow, and essential website features that improve conversion performance.
Increased Revenue - By identifying opportunities to improve conversion rates and order values, analytics directly contributes to revenue growth.
Strategic Product Planning - Analytics highlights which products generate the highest demand, helping businesses make informed merchandising decisions.
Scalable Business Growth - Data-driven strategies enable companies to scale operations while maintaining efficiency and profitability.
eCommerce Analytics in India: What Makes It Different?
In India, eCommerce analytics goes beyond traditional metrics due to unique market conditions such as:
- High Cash on Delivery (COD) usage
- Higher Return-to-Origin (RTO) rates
- Price-sensitive customers
- Multi-channel buying behavior
Because of this, Indian businesses must track additional operational metrics such as:
- RTO rate
- Delivery success rate
- COD conversion rate
- Courier performance by pincode
This is where integrating logistics data becomes critical for accurate analytics.
Challenges in eCommerce Analytics
While eCommerce analytics helps businesses make data-driven decisions, implementing and interpreting analytics systems can come with several challenges.
1. Data Overload
Modern analytics platforms generate massive volumes of data. Without clear objectives and proper filtering, businesses may struggle to identify meaningful insights. Instead of tracking every available metric, companies should prioritize key performance indicators (KPIs) that directly impact revenue and growth as recommended in logistics KPIs for eCommerce.
2. Tracking Errors
Analytics data is only as reliable as the tracking setup behind it. Incorrect tracking configurations, missing tags, or improperly implemented scripts can produce inaccurate reports. These errors can lead businesses to make decisions based on misleading data.
3. Attribution Complexity
Customers rarely convert after interacting with a single marketing channel. They often engage with multiple touchpoints such as social media ads, search engines, email campaigns, and direct visits. Determining which channel truly influenced a purchase can therefore become complex, making accurate marketing attribution challenging.
4. Integration Issues
Many eCommerce businesses rely on multiple tools, including website platforms, advertising systems, CRM software, and analytics tools. When these systems are not properly integrated, data may become fragmented or incomplete, making it harder to build a unified view of customer behavior.
Common eCommerce Analytics Mistakes
Even when analytics tools are available, businesses often fail to extract their full value due to common strategic mistakes.
1. Focusing Only on Traffic
High website traffic does not necessarily translate into higher sales. Many businesses prioritize visitor growth but overlook conversion rate optimization (CRO). Improving product pages, checkout flows, and user experience is just as important as attracting visitors.
2. Ignoring Customer Retention Metrics
Customer acquisition is important, but focusing only on new customers can limit long-term growth. Retaining existing customers is usually more profitable, which makes metrics such as Customer Lifetime Value (CLV) and repeat purchase rate critical for sustainable success.
3. Not Segmenting Data
Analyzing all users together often hides valuable insights. Data segmentation allows businesses to identify patterns in different audience groups. Segmenting analytics data by customer type, traffic source, device, or product category can reveal which channels and customers drive the highest revenue.
4. Poor Analytics Setup
Improper analytics implementation can undermine the entire reporting process. Incorrect tracking codes, incomplete event tracking, or misconfigured analytics tools lead to inaccurate data. Regular audits and correct configuration are essential for maintaining reliable analytics insights.
Best Practices for Effective eCommerce Analytics
To fully leverage analytics, businesses should follow structured and data-driven practices.
1. Focus on Key Performance Metrics
Rather than tracking hundreds of metrics, businesses should concentrate on the most impactful indicators such as conversion rate, Customer Acquisition Cost (CAC), Customer Lifetime Value (CLV), and Average Order Value (AOV). Monitoring these metrics consistently provides a clearer picture of business performance.
2. Apply Data Segmentation
Segmenting analytics data helps businesses understand performance across different audiences and marketing channels. For example, analyzing data by customer type, traffic source, and product category can reveal high-performing segments and opportunities for optimization.
3. Continuously Test and Optimize
Successful eCommerce brands regularly experiment with improvements. Running A/B tests on product pages, pricing strategies, checkout experiences, and marketing campaigns helps identify changes that increase conversions and overall revenue.
4. Analyze Customer Behavior
Understanding how visitors interact with a website is essential for improving user experience. Tools such as heatmaps, session recordings, and user journey analysis reveal where users engage the most and where they drop off during the buying process.

Data-Driven Growth Insights
Data analytics directly impacts the growth and profitability of eCommerce businesses. Even small improvements in key metrics can produce significant financial gains.
Companies that effectively leverage analytics consistently outperform competitors by improving marketing efficiency, customer retention, and overall operational performance.
Global consulting research from BCG's analytics practice shows that organizations using advanced analytics achieve stronger operational performance and faster revenue growth.
Smarter Logistics Analytics for Better eCommerce Decisions
While most businesses focus only on marketing data, logistics performance is equally important in eCommerce analytics.
Metrics like:
- Delivery success rate
- RTO percentage
- Courier performance
- Delivery timelines
directly impact conversion rates, customer satisfaction, and repeat purchases.
Platforms like iCarry help businesses integrate logistics data into their analytics by providing:
- Real-time shipment tracking
- Courier performance insights
- RTO analysis
- Delivery success optimization
This allows businesses to move beyond surface-level analytics and gain end-to-end visibility from order to delivery, leading to better decision-making and improved profitability.
eCommerce Analytics vs Web Analytics
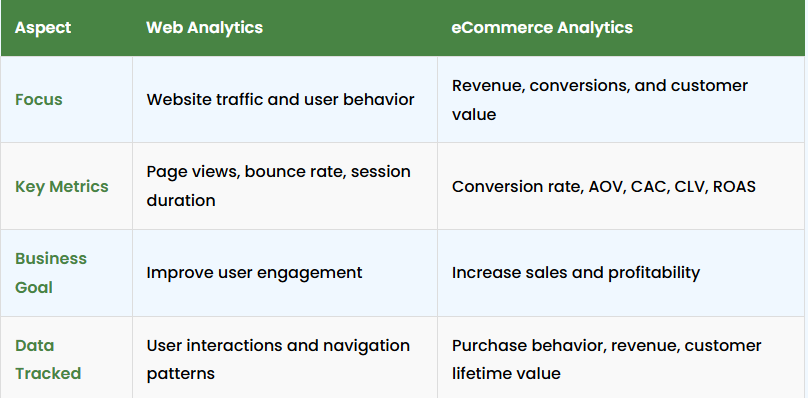
While web analytics focuses on website traffic and user behavior, eCommerce analytics goes deeper by analyzing purchase patterns, revenue metrics, customer lifetime value, and conversion performance. eCommerce analytics helps businesses understand not only how users interact with a website but also how those interactions translate into revenue.
Conclusion
eCommerce analytics is one of the most powerful tools for understanding and improving online business performance. By tracking the right metrics, analyzing customer behavior, and optimizing marketing strategies, businesses can unlock significant growth opportunities.
In an increasingly competitive digital marketplace, data-driven decision-making helps businesses improve conversion rates, increase customer lifetime value, and scale their operations more efficiently.
Businesses that build strong analytics capabilities gain a strategic advantage by transforming raw data into actionable insights.
Using Logistics Data in eCommerce Analytics for Better Fulfillment Performance
Successful eCommerce operations depend not only on marketing analytics but also on efficient logistics and fulfillment processes. Businesses that integrate operational data with analytics can optimize shipping performance, reduce delivery delays, and improve logistics efficiency across their fulfillment networks.
How Logistics Data Improves eCommerce Analytics
Integrating logistics data with eCommerce analytics allows businesses to track shipping performance, delivery times, and fulfillment efficiency. Operational analytics can significantly improve customer experience and reduce delivery delays as highlighted in AI logistics trends.
Integrating logistics data into eCommerce analytics allows businesses to go beyond marketing insights and gain full visibility into fulfillment performance. Tracking delivery timelines, courier success rates, and exception patterns helps identify operational gaps that directly impact customer experience and repeat purchases.
When logistics data is connected with analytics, businesses can better understand how factors such as delayed deliveries, failed attempts, or high RTO rates affect overall performance metrics like conversion rate and customer lifetime value. This creates a more complete, end-to-end view of the business—from order placement to final delivery.
In practice, this level of operational visibility improves when businesses use centralized logistics systems that combine shipment tracking, courier performance monitoring, and delivery analytics in one place. iCarry enables this by helping businesses track shipments in real time, monitor courier efficiency, and manage delivery operations with greater clarity and control.
By aligning logistics data with eCommerce analytics, businesses can move from reactive issue handling to proactive optimization—improving fulfillment efficiency, reducing delivery related losses, and creating a more reliable customer experience at scale.
Frequently Asked Questions (FAQs)
What is eCommerce analytics?
eCommerce analytics is the process of collecting and analyzing data from online stores to understand customer behavior, marketing performance, and business growth opportunities.
What are the most important eCommerce metrics?
Key metrics include conversion rate, customer acquisition cost (CAC), average order value (AOV), customer lifetime value (CLV), and cart abandonment rate.
Which tools are used for eCommerce analytics?
Popular analytics tools include Google Analytics, Shopify Analytics, Mixpanel, and Hotjar.
Why is data analytics important for online businesses?
Analytics helps businesses understand customer behavior, optimize marketing campaigns, improve conversion rates, and make data-driven decisions.
What is a good conversion rate for an eCommerce store?
The average eCommerce conversion rate typically ranges between 1 - 3%, although optimized stores may achieve 5% or higher.
How can businesses improve their eCommerce analytics strategy?
Businesses can improve analytics by tracking key metrics consistently, segmenting customer data, running A/B tests, and using advanced analytics tools.
eCommerce analytics is the process of collecting and analyzing data from online stores to track performance, understand customer behavior, and improve sales—enabling businesses to measure conversion rates, optimize marketing ROI, reduce cart abandonment, and make data-driven decisions that directly impact revenue growth and customer lifetime value.